Self-host Uptime Kuma: a status page in 10 minutes with Docker
Published 2026-10-06 · tested on Ubuntu 24.04, Intel Core Ultra 7 255H, Docker 29
TESTED — we actually deployed this
Uptime Kuma is the self-hosted answer to UptimeRobot and Pingdom: a monitoring dashboard that pings your sites, APIs, and databases, and alerts you when they go down. No per-monitor pricing, no 5-minute-interval paywall — your hardware, your rules.
We deployed version 2 from scratch, measured its actual resource usage, and broke a couple of monitors on purpose to see what failure looks like. Everything below is from that run.
What you need
- Any machine with Docker — we used a workstation with 30 GB RAM, but our measurements show 256 MB free RAM is plenty
- 1 GB free disk (the image alone is 574 MB)
- 5-10 minutes
Docker not installed? On Ubuntu/Debian: curl -fsSL https://get.docker.com | sh
Step 1: the Compose file
Make a directory and drop this in as compose.yaml:
services:
  uptime-kuma:
    image: louislam/uptime-kuma:2
    container_name: uptime-kuma
    volumes:
      - kuma-data:/app/data
    ports:
      - "3001:3001"
    restart: unless-stopped

volumes:
  kuma-data:
Two deliberate choices here:
- Named volume (
kuma-data) instead of a bind mount — survives container recreation and avoids the host-permissions mess that bind mounts cause on some systems. restart: unless-stopped— the container comes back after reboots without systemd units or cron hacks.
Step 2: start it
docker compose up -dFirst run pulls the image (574 MB — a minute or two on decent broadband). Then open http://localhost:3001 (or http://<machine-ip>:3001 from another device on your network).
Step 3: database choice (new in v2)
Version 2 asks which database to use before anything else:
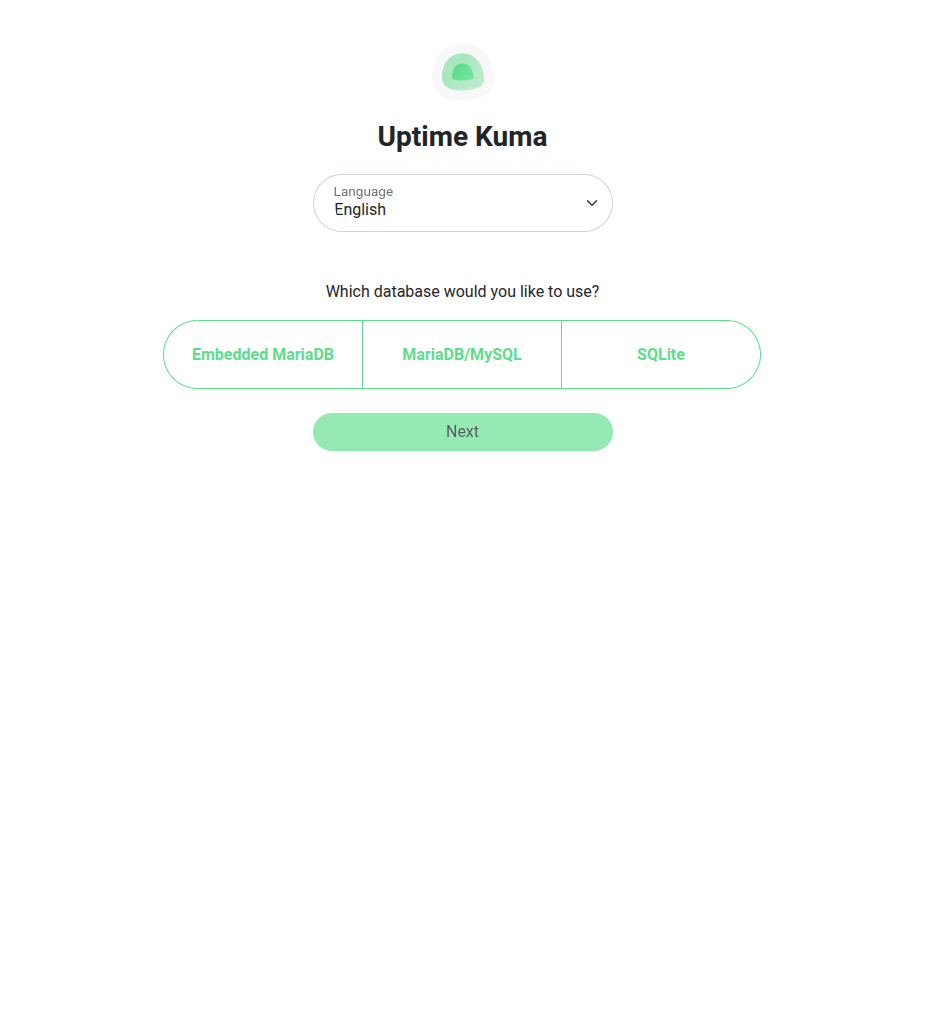
Pick SQLite for a homelab. The embedded MariaDB option exists for large installations (hundreds of monitors); for anything under ~50 monitors, SQLite is simpler, uses less RAM, and backs up as a single file. After 2 months with 3 monitors, our SQLite data volume was under 2 MB.
Then create your admin account. Use a real password manager entry — this dashboard knows every URL you care about.
Step 4: add monitors
Add New Monitor → pick a type → paste a URL. We set up three real ones:
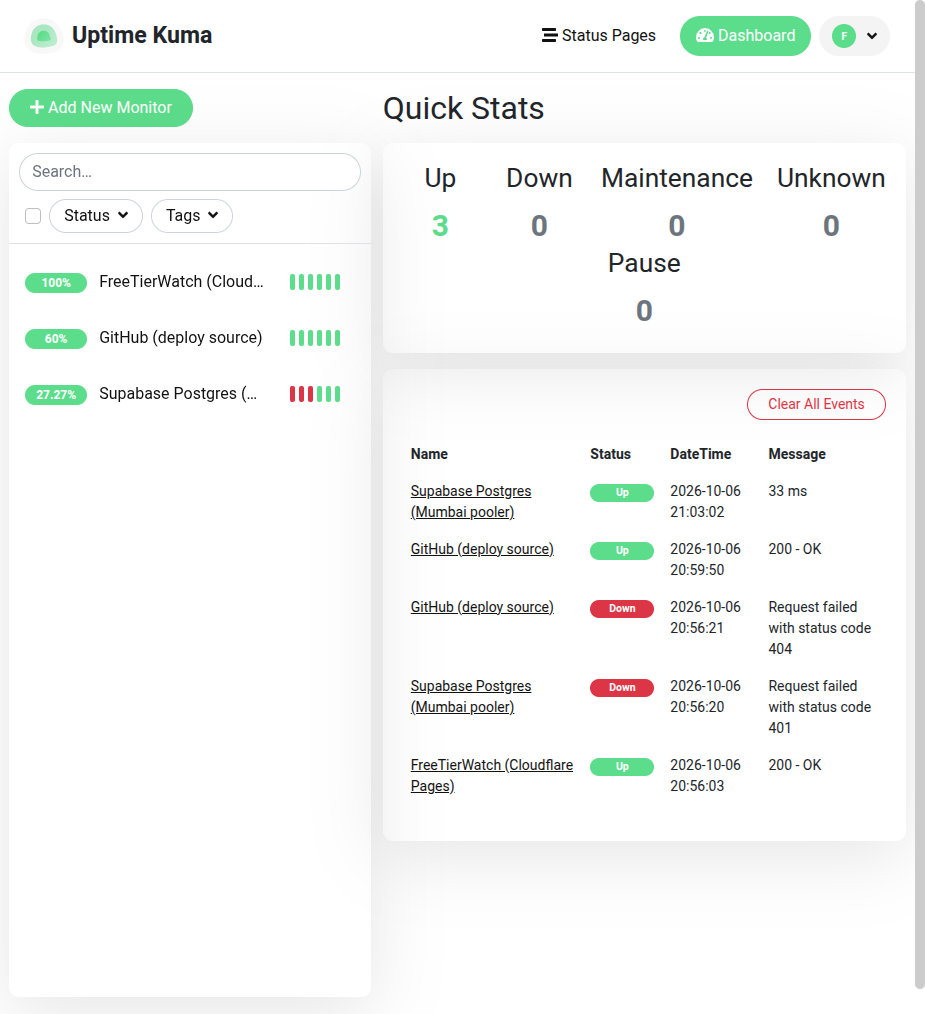
Lessons from the two monitors we got wrong on the first try (visible as red in the history — we left them in deliberately):
- HTTP-monitoring a private GitHub repo returns 404. The unauthenticated check sees what a logged-out user sees. Monitor something public, or use a keyword/API monitor with a token.
- Supabase’s REST endpoint returns 401 without an API key — “down” according to an HTTP monitor even though the service is fine. For databases, use a TCP Port monitor instead: ours checks the Postgres pooler on port 5432 and reports ~33 ms from India to Mumbai.
That’s the general rule: HTTP monitors for pages, TCP monitors for databases and services that require auth.
What it actually costs to run (measured)
| Metric | Measured value |
|---|---|
| Image size | 574 MB |
| RAM, idle (0 monitors) | 143 MB |
| RAM, 3 active monitors (60s interval) | 133–147 MB |
| CPU, idle | 0.02% |
| CPU, 3 monitors | ~0.7–0.9% of one core |
| Disk (data volume, 3 monitors) | 1.4 MB |
Restart time (docker restart) |
1.6 s, serving again in under 10 s |
Translation: Uptime Kuma runs comfortably on a Raspberry Pi, a 10-year-old laptop, or the smallest VPS money can buy. RAM is the only number that matters, and it stays well under 200 MB.
Gotchas
- The monitor is only as available as the machine it runs on. Our test box is a workstation that isn’t on 24/7 — fine for learning, useless for real alerting. See below.
- Port 3001 conflicts: if something already listens there, change the left side of the mapping (
"3002:3001"). - No built-in HTTPS. On a LAN that’s fine; exposing it to the internet needs a reverse proxy (Caddy/Traefik/nginx) in front — or better, don’t expose it and use Tailscale.
- Updates:
docker compose pull && docker compose up -d. The named volume keeps your data.
Backups
Everything lives in one volume. Snapshot it with:
docker run --rm -v kuma-data:/data -v "$PWD":/backup alpine \
  tar czf /backup/kuma-backup-$(date +%F).tar.gz -C /data .
Cron that weekly and copy it somewhere that isn’t the same disk.
When NOT to self-host this
- Your monitoring box isn’t always on. A monitor that’s offline when your site goes down is theatre. If you don’t have an always-on machine, run Uptime Kuma on a free or cheap cloud box — Oracle’s Always Free tier fits it with room to spare, or any ~$4-6/mo VPS.
- You’re monitoring the same machine the monitor runs on. It can’t tell you it’s down.
- You need SMS alerting and SLA reports for a client contract — paid services earn their fee there.
What we actually ran this on
- Machine: Intel Core Ultra 7 255H (16 cores), 30 GB RAM, NVMe — massively overkill; see measurements above for what it actually needs
- OS: Ubuntu 24.04.5 LTS, x86_64
- Docker: 29.8.1, Compose v5.1.3
- Uptime Kuma:
louislam/uptime-kuma:2(v2, SQLite backend) - Date: 2026-10-06